

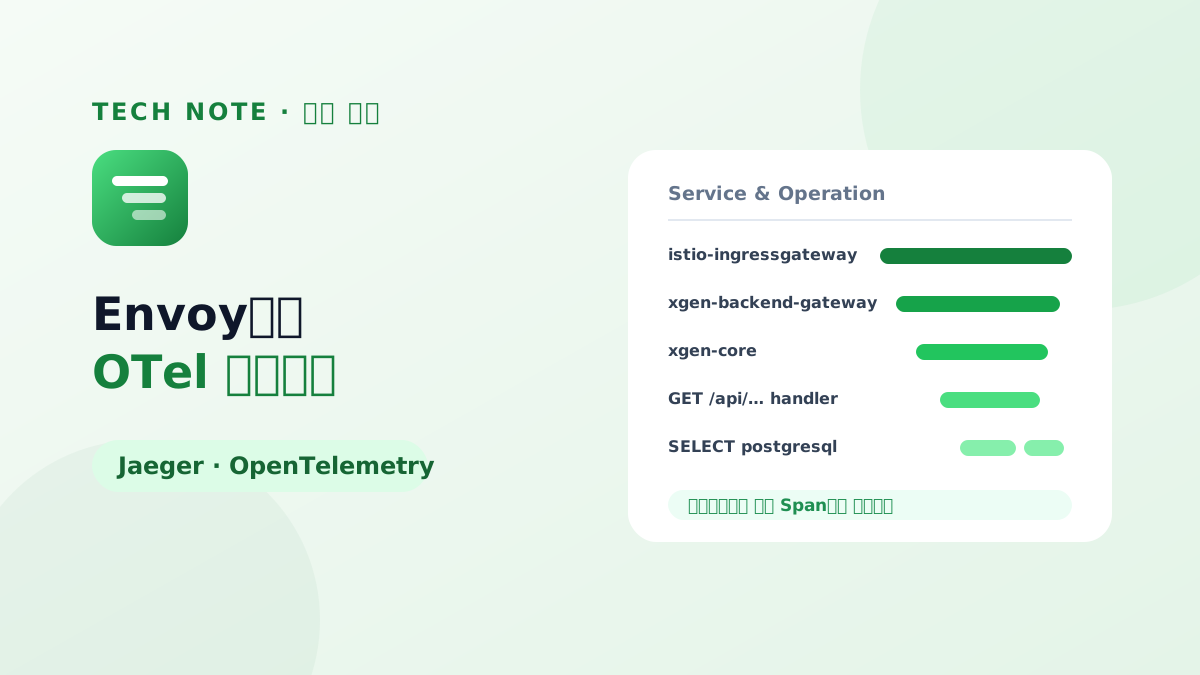
Migrating the XGEN service to a new server for the L Home Shopping project gave us the occasion to bring in something new: Jaeger tracing.
Observability is usually described through three types of telemetry signal — metrics, logs, and traces — and of the three, traces are the more recent addition. Where a metric shows what state the system is in right now and a log shows what happened, a trace shows by what path it happened, and where it slowed down.
Take an /example API in a microservice architecture that passes through services A → B → C. With traces in place, a bottleneck or an error on /example can be pinned to whichever of A, B, or C actually caused it, with far less guesswork.
This being a first go, the shape of it may differ from what a seasoned practitioner would build. The aim was to put traces to real use in bottleneck analysis, and to grow this into an architecture we can apply more rigorously on the next project.
What follows is the record of that rollout. It walks through three choices in the order they were made: starting from the Envoy sidecar already in place, looking at eBPF and setting it aside once the kernel version blocked it, and landing on OpenTelemetry auto instrumentation. If you are weighing the same decision, this should show you where each route runs out of road.
The limits of distributed tracing on an Envoy sidecar
XGEN service pods already had an Envoy sidecar injected, so the first attempt was to build distributed tracing out of Envoy spans alone. We connected a Zipkin receiver to Jaeger and set the mesh tracing provider to zipkin. As is fairly well known, this approach ran into problems.
Service & Operation

istio-ingressgateway.istio-system
└─ xgen-backend-gateway.xgen.svc.cluster.local:8000/api/*          200
   └─ xgen-backend-gateway.xgen
      └─ xgen-backend-gateway.xgen.svc.cluster.local:8000/api/*    200 POST
         └─ xgen-backend-gateway.xgen
            └─ xgen-workflow.xgen.svc.cluster.local:8000/*         200 POST  22.0ms
               └─ xgen-workflow.xgen
                  └─ xgen-workflow.xgen.svc.cluster.local:8000/*   200 POST  20.8ms
Readability was the first problem. Envoy does not instrument at the application level; it creates spans at the proxy level. Operation names therefore stayed at the granularity of /api/*, with no application-level spans surfacing beneath them. Working out "what a given API actually did" was not straightforward.
The larger problem was that trace context does not propagate. Envoy creates spans only for the segment of the request it handled; it does not pass that trace context down into the application code. So even when a request travels A → B → C, the trace breaks at each service boundary and the continuity distributed tracing depends on is lost — A → B and B → C end up recorded as separate things.
Ways to propagate trace context
Inserting it into the code
Several options present themselves. In a course I took some time ago, one case solved this by inserting header-propagation logic directly at the code level. That approach means adding propagation logic to every service in operation, one at a time — and as someone who is not the developer of those services, the overhead of touching existing code and the risk of side effects made it a poor fit.
Zero-instrumentation collection with Beyla eBPF
eBPF is the most talked-about of the zero-code instrumentation approaches at the moment. Unlike an auto-instrumentation agent, which reaches inside the application process and manipulates bytecode, it observes traffic at the kernel level and generates spans from there. On inspection, Beyla offered BEYLA_BPF_TRACK_REQUEST_HEADERS, an option that reads the traceparent header on an incoming request and injects it into outbound ones — a direct answer to the trace-context propagation problem.
Found incompatible Linux kernel, disabling trace information parsing
An unexpected obstacle stopped it: the RHEL 4.18 kernel on the server was not properly compatible with that feature. This route was closed as well.
Applying OpenTelemetry auto instrumentation
We settled on auto instrumentation — the OpenTelemetry zero-code approach that reaches inside the application process and manipulates bytecode. Install the OTel Operator with Helm, add the instrumentation.opentelemetry.io/inject-python=true annotation to the XGEN namespace, and the Operator picks it up and injects instrumentation into the Python application pods automatically.
Service & Operation

istio-ingressgateway.istio-system
└─ egress GET
   └─ xgen-backend-gateway
      └─ ingress 200 GET
         └─ xgen-backend-gateway
            └─ egress xgen-core:8000 200 GET
               └─ xgen-core
                  └─ ingress 200 GET
                     └─ xgen-core
                        └─ GET /api/admin/agent-token/usage 200 GET
                           ├─ xgen-core  SELECT  postgresql
                           ├─ xgen-core  SELECT  postgresql
                           └─ ...
Because instrumentation happens inside the application process, concrete application-level spans — FastAPI routes, database queries — now appear, which settles the readability problem. And since the OTel SDK propagates trace context between requests through the standard mechanism, the broken traces at service boundaries we hit with the Envoy sidecar are resolved along with it.
Where you instrument decides what a trace is worth
One question ran through all three choices: where to put the instrumentation. The proxy (Envoy), the kernel (eBPF), the application process (OTel) — the same request leaves a different record depending on the point you observe it from.
At the proxy level we could confirm the path a request travelled, but not what that request actually did. The same reason explains the story breaking at each service boundary: it could not pass trace context down to the application. In the end, where you observe from decided the resolution you observe at.
The other thing this confirmed is that a technology choice is not settled by the right answer on paper alone. eBPF had a clear one in BEYLA_BPF_TRACK_REQUEST_HEADERS, and it ran into the constraint of the RHEL 4.18 kernel actually in use on the server. What actually runs on this server decides the outcome more often than what the most advanced approach happens to be.
As noted at the outset, this rollout may sit some distance from a textbook setup. The aim, though, was clear from the start — to put traces to real use in bottleneck analysis, and to grow this into an architecture we can apply more rigorously on the next project. With application-level spans visible and traces carrying across service boundaries, that is where it starts.