

Editor's note · The B2B customer perspective — What customers want to understand is not the volume of logs, but how far they can trace the cause of a delayed or failed business operation and respond to it. This contribution describes operational experience in tracing execution down to individual agent nodes, model calls, and tool calls, beyond service-level monitoring. When assessing adoption, consider not only whether a dashboard is available, but also the ability to trace causes during incidents, alert accuracy, the scope of sensitive data collection, and operational ownership and accountability.
The gap in node-level tracing for AI agent workflows
While building infrastructure for the L Home Shopping project, I found that XGEN already had solid metrics and log collection, but trace collection was less developed. I therefore introduced an experimental distributed tracing setup using OTel and the Jaeger UI. I still believe that was the right direction. However, spending more time in the field and thinking through the requirements revealed some gaps.
The biggest issue was the nature of the product: an enterprise AI agent solution. Customers were most interested in why an agent workflow was slow or why it failed. OTel auto-instrumentation measures standard boundaries such as HTTP and database calls. That can identify ordinary CRUD API bottlenecks, but it does not instrument the specialized boundaries of AI agent workflows and nodes. It could not answer questions such as “Which node was slow?” or “Which node failed?”
I had seen the same issue in the requirements for the earlier J Bank project. They included detecting agent node execution errors, MCP tool execution failures, and timeouts. Yet the response had been summarized as “provide a log screen,” without defining how to show which node or execution stage was responsible.
Both projects pointed to the same product direction. Service- and infrastructure-level observability was available or achievable, but node execution boundaries could not be created without explicit instrumentation inside the application. I wanted to see how other solutions addressed this.
Node-level tracing: the n8n example
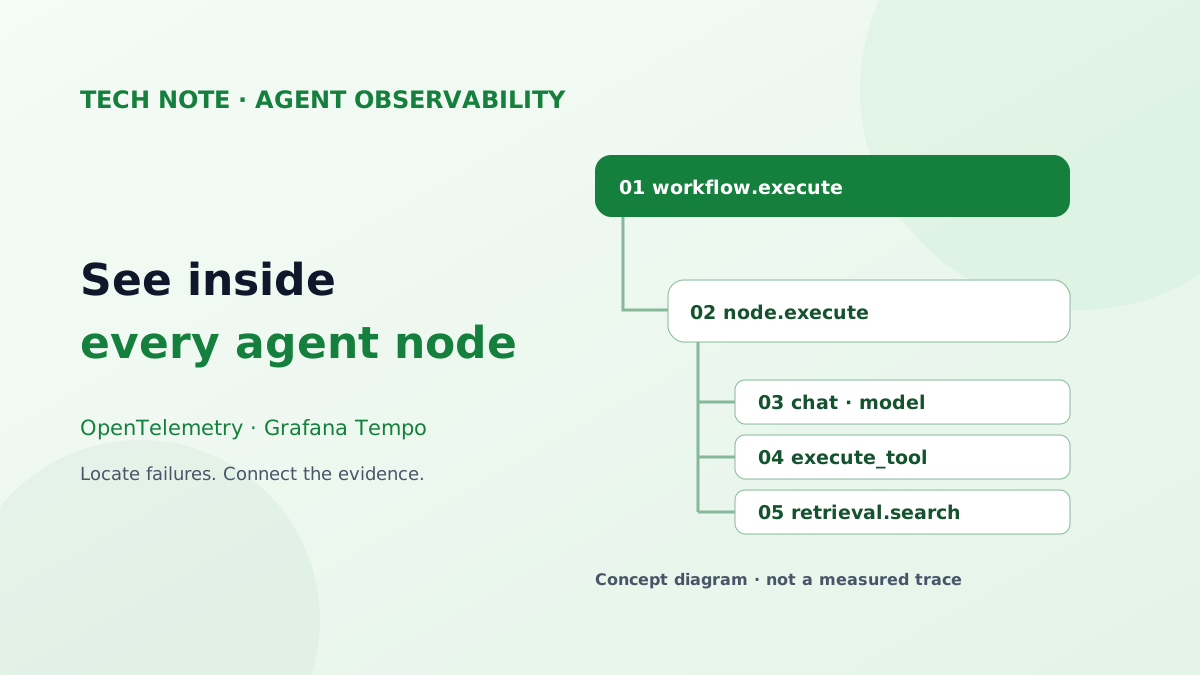
In my research, I looked at the open-source automation platform n8n. Its official documentation offered guidance on tracing workflows at the node level. n8n nests a node.execute span for each node inside a workflow.execute span, includes attributes such as node IDs, names, and input/output item counts, and exports them over OTLP. Users can connect a backend such as Grafana Tempo or Jaeger UI. Agent functionality also adds execute_tool spans for tool-call tracing, and failed nodes record exceptions in their spans, narrowing the investigation to the failing node. I thought this was a useful reference for our problem.
from service.observability import (
    SPAN_WORKFLOW_EXECUTE, Kind as SpanKind,
    end_span, fail_span, hash_identifier,
    set_attributes, start_span,
)
from service.observability import attributes as otel_attrs

_wf_span = start_span(
    SPAN_WORKFLOW_EXECUTE,
    kind=SpanKind.INTERNAL,
    attributes={
        otel_attrs.XGEN_WORKFLOW_ID: workflow_id,
        otel_attrs.XGEN_WORKFLOW_NAME: workflow_name,
        otel_attrs.XGEN_INTERACTION_ID: interaction_id,
        otel_attrs.XGEN_EXECUTION_MODE: (
            "sub_workflow" if workflow_call_stack else "root"
        ),
        otel_attrs.ENDUSER_ID: hash_identifier(user_id),
        otel_attrs.XGEN_OWNER_ID: hash_identifier(owner_id),
    },
)
Designing distributed tracing for AI agents
The lesson was clear: standard instrumentation does not capture domain boundaries such as workflow and node execution. We needed to open custom spans inside the code using the OTel SDK. I designed manual instrumentation around the start_span/end_span wrappers in a single entry-point package, service.observability. Workflow and node spans would carry XGEN-specific attributes such as workflow_id, interaction_id, and execution mode, providing evidence for node-level tracing.
That alone was not enough, because of an important architectural difference. In the monolithic n8n architecture I was examining, workflow execution completed within a single process. XGEN uses microservices, and a workflow can cross services—for example, from xgen-workflow to xgen-document or xgen-mcp-station. Adding only node-level manual instrumentation risked losing trace context at service boundaries.
To close that gap, I put zero-code instrumentation in place before manual instrumentation. I deployed the OTel Operator in the Kubernetes cluster to establish the control plane for pod-level instrumentation injection, and registered Python as the target runtime. Adding the instrumentation.opentelemetry.io/inject-python: "true" annotation to a workload then allowed the Operator to inject instrumentation libraries through sidecar/init-container mechanisms, creating spans at standard HTTP and database boundaries without code changes. On top of this cluster-wide plumbing, installed without changing agent code, we added workflow and node spans with the OTel SDK. That completed the two-layer architecture.
Turning node-level instrumentation into code
With the design in place, implementation revealed several additional needs.
I restricted direct opentelemetry imports to four files: otel.py, instrument.py, context.py, and spans.py. Everything else referenced only service.observability. This allowed helpers to behave as no-ops when tracing was disabled, leaving application behavior unchanged. I also clarified the division of responsibility with auto-instrumentation. Creating a TracerProvider directly conflicted with the provider configured by the opentelemetry-instrument agent, so we reused an existing provider and created a fallback only when none existed. Threading instrumentation was essential too: workflow nodes ran in worker threads, and without it, spans below node.execute scattered into orphaned traces.
The resulting span hierarchy was:
workflow.execute
└─ node.execute
   └─ invoke_agent {agent}
      ├─ chat {model}
      ├─ execute_tool {tool}
      └─ retrieval.search
Instead of an _closed flag, AgentTurnSpan, OutcomeSpan, and ToolSpanTracker objects managed span lifecycles. This avoided missing a flag update in functions with many early-return paths. We also distinguished cancellation from actual errors, so a user disconnecting a stream would not appear as an outage. Execution had split into a new runtime and a LangChain-based path; I addressed that by attaching an AgentTraceBridge to the existing TraceCollector shared by both. This also kept the span hierarchy intact when agent implementation moved into an external library and local instrumentation code disappeared. Finally, safe_attributes() always excluded keys such as api_key, token, and credential, and filtered prompt/response fields unless their capture flag was enabled.
Connecting traces to dashboards and alerts
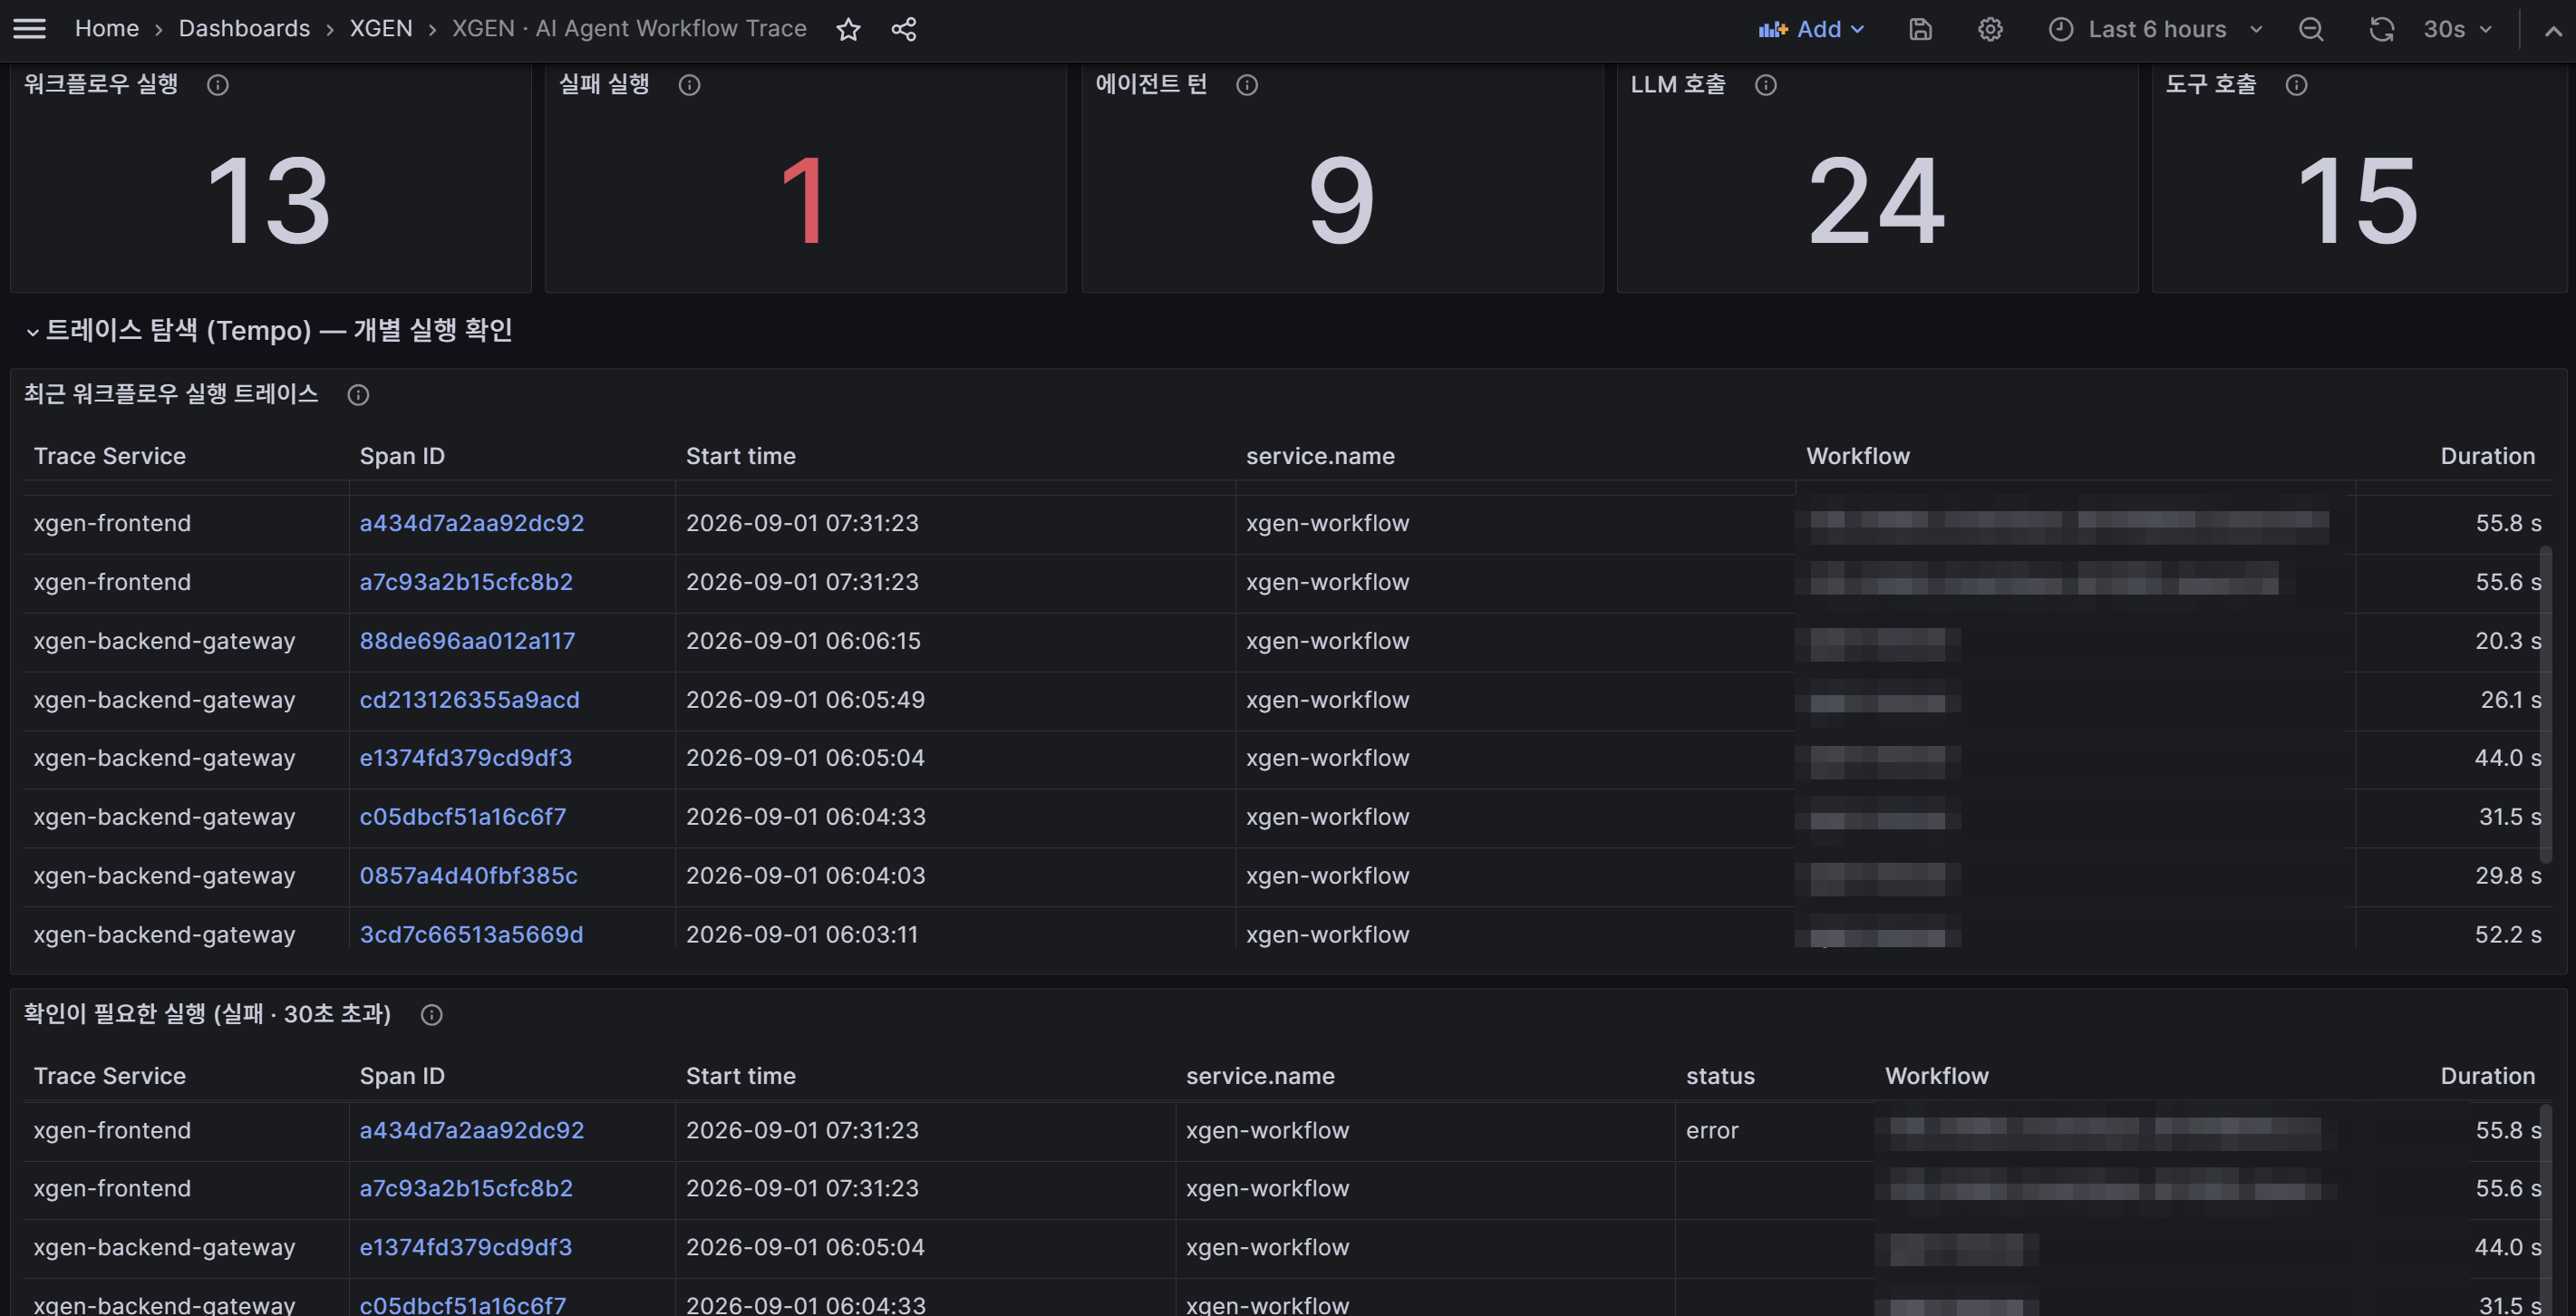
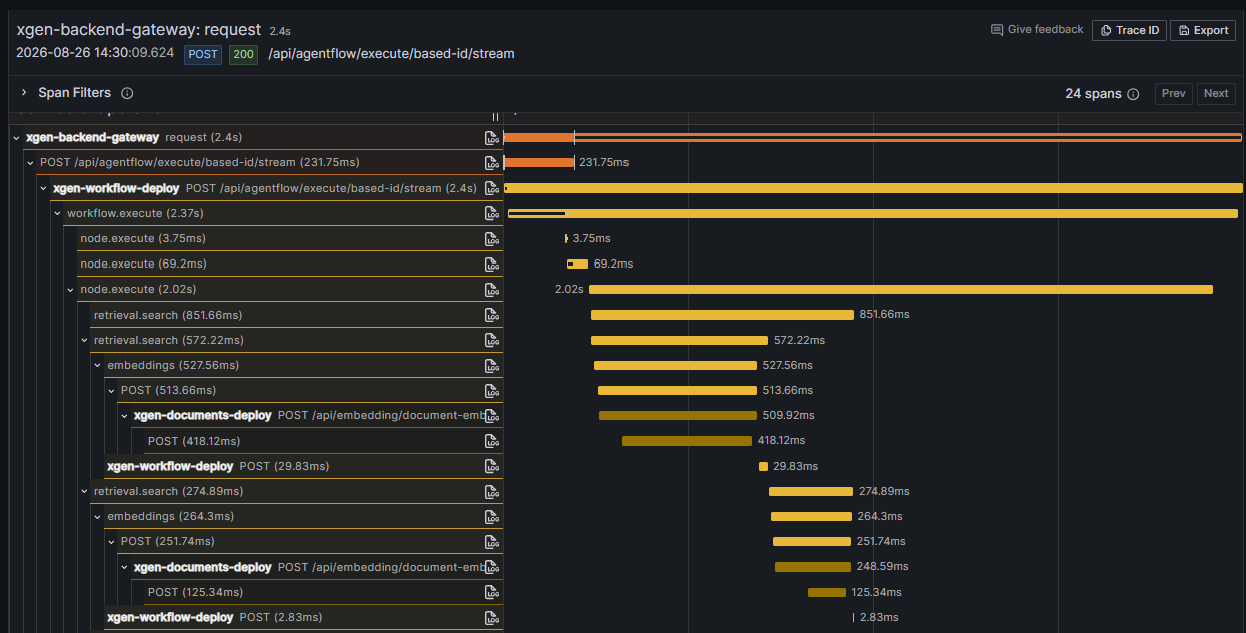
After implementing distributed tracing in the architecture and code, we needed a UI to make it visible.
Jaeger UI, which I had used before, has a low entry barrier: it provides form-based search without a separate query language and includes a service dependency graph. But as a standalone tool, it required switching away from Grafana to see metrics and logs.
Grafana Tempo requires learning TraceQL, and its lack of a separate index makes attribute-based search more limited than Jaeger. On the other hand, it fits into the Grafana ecosystem we already use, brings logs and metrics into the same interface, and supports custom dashboard panels for workflow executions, agent turns, and tool calls.
I chose Grafana Tempo. We already used Grafana for metrics and logs, so we could extend the same interface, trigger AI agent workflow alerts through Grafana Alerting, and customize dashboards more freely than in Jaeger UI.
Because nobody can watch a dashboard continuously, I configured workflow alerts as well. They separately monitor whether Tempo itself is down, whether span collection and metric generation have become disconnected, whether many workflows are failing in a platform-wide incident, whether a specific workflow keeps failing, and whether RAG retrieval is failing silently. Requirements in the J Bank project that had previously been grouped under “provide a log screen”—agent node errors, MCP tool failures, and workflow failures—finally took concrete form in these dashboards and alerts.
Closing thoughts
This is the path we took to answer the questions we encountered in the field: “Which node was slow?” and “Which node failed?” We laid the foundation with zero-code instrumentation, then added domain boundaries by explicitly opening workflow and node spans through the OTel SDK. Implementation exposed details absent from the initial design: conflicts with auto-instrumentation, context discontinuities, and lifecycle management. Finally, dashboards and alerts in Grafana Tempo made the results visible and actionable.
There are still open tasks. LLM chat spans had no error-marking path, so we could not alert on model response errors. Tool-call failures were mixed with normal retries in the ReAct loop and needed further classification. We also had not enabled workflow P95 latency alerting because of the limitations of Tempo's default histogram buckets. Our next step is to turn these three areas into signals we can actually trust.
Editor's closing perspective · Adoption and operational agreements — Applying this implementation in a real customer environment requires verifying, against representative incident scenarios, that identifying the failure point leads to tracing related calls and action by the responsible team. Operational criteria and responsibilities must also be defined in advance: how to distinguish normal retries from failures and user cancellations, alert routing and response procedures, data retention and access permissions, and collection costs. LLM error alerts, tool-failure classification, and P95 latency measurement currently require further validation; it is appropriate to treat them as future improvement tasks rather than guaranteed capabilities or SLAs. Ultimately, what matters to customers is not the volume of charts or logs, but how quickly they can identify the cause of a problem and connect that insight to an actual response and recovery.